
Autonomy Visualization Revamp
At Nuro, I led a critical revamp to visualize the 3D viewer used for in-vehicle operations. I managed the project timeline and helped bridge the gap between design and engineering by making direct contributions in Unity.
Timeline
1.5 months
Role
Designer
Prototyper
Project Manager
Tools
Unity
Christoph Sokol (3D Designer)
Christian Giancarlo (Engineer)
Eric Yi (Design Manager)
How might we develop a new design language for Nuro’s 3D viewer?
Opportunities
Competitive Visuals
Compared to its competitors, Nuro’s viewer lacked the visual sophistication to match its advanced tech underneath.
This was critical for any investor demo that would bring funding to the company.
Safety
For all operational tools, safety is always our number one priority. Clarity in visual cues was essential to help our operators make prompt on-road decisions.
Outcome
Final highlight reel, derived from real driver log data.
Key Highlights
Injecting the Brand
Agent shapes were driven from the pill shape located at the heart of Nuro’s “O”.

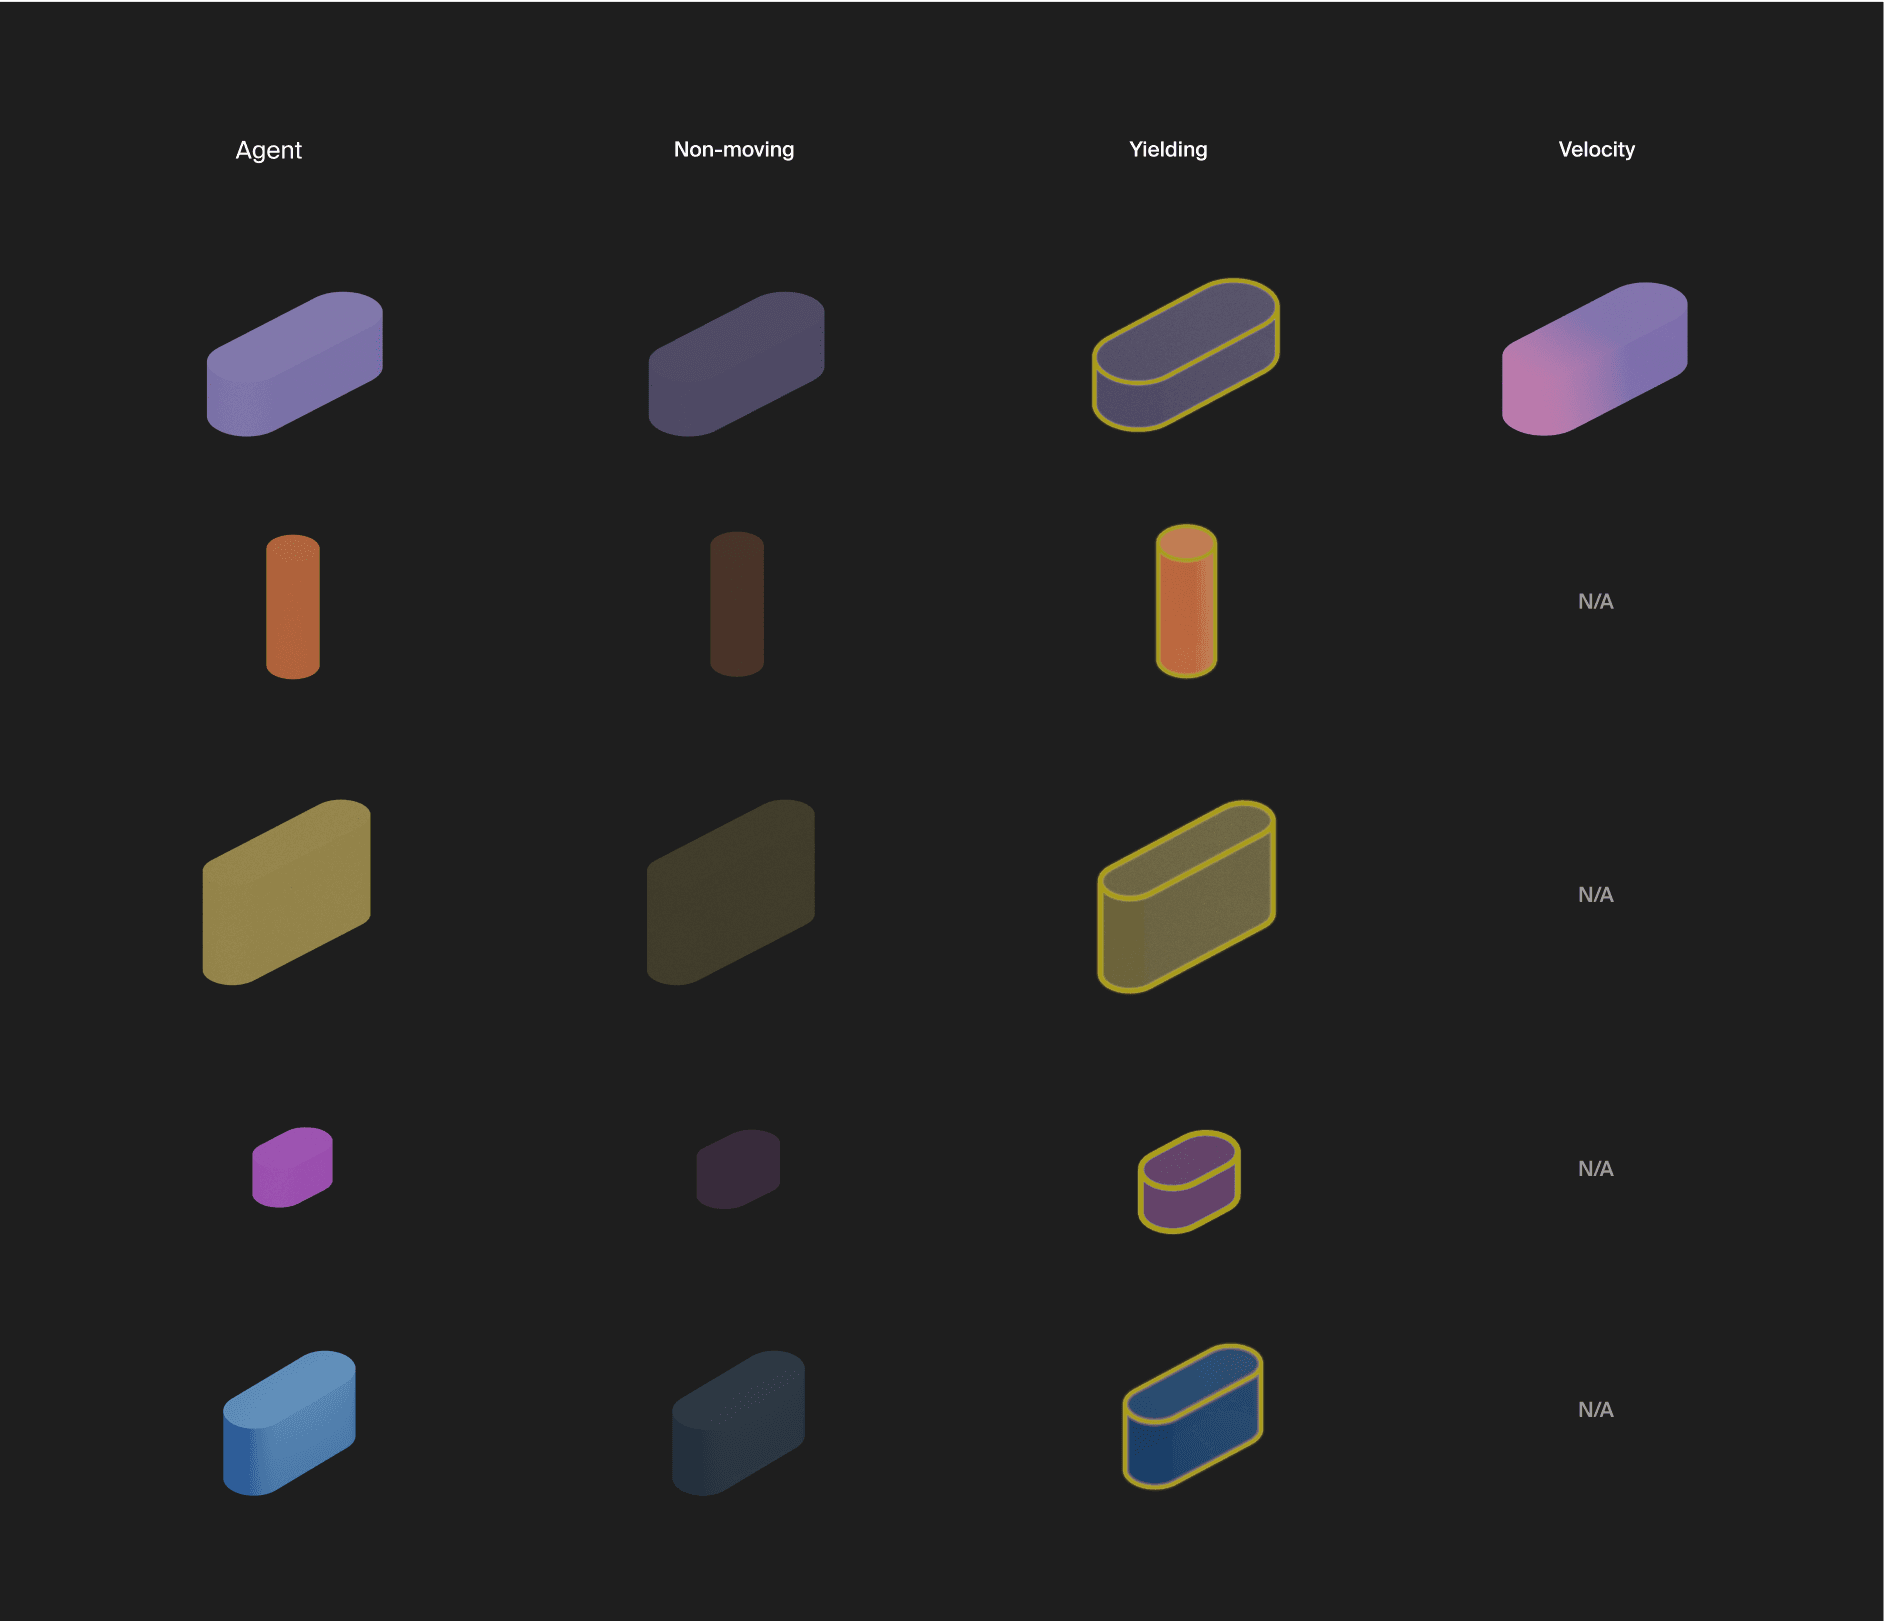
Agent States
At a busy intersection or a crowded parking lot, multiples of similar agents can create a cognitive load for operators.
As such, I helped establish a better taxonomy to distinguish between different states of agents, by taking advantage of existing agent data like velocity and current yield state.

Parking Lot Blender Prototype by Christoph Sokol
Establishing the Environment
By experimenting with multiple rendering pipelines with real driver log data, I reached a solution that mediated between technical feasibility and visual clarity.


Before

After
Reducing visual clutter and increasing perception of important agents.
Enhancing Visual Hierarchy
Safety critical features, like pedestrians, cyclists and occupied crosswalks have the highest emission and saturation to bring attention in the scene.

2D UI
I refreshed the 2D elements to complement the simplicity of 3D.

1
Log duration, Disk space, and Localization have been modularized to reduce unnecessary real estate.
2
Zones and speed limit are located persistently on the bottom right for easy location.
In-Vehicle Validation

Through multiple test requests, I was able to bring pointed improvements to our experience and validate our prototypes before final release.
Reflections
Prioritize ruthlessly
In order to bring practical changes to our viewer along an accelerated timeline, I prioritized elements that would surface most frequently and would have the highest safety impact. This helped us sharpen our focus, without getting too lofty with our vision.
Stress test your prototype
Playing our prototype with real driver log data helped us cover a lot of edge cases fast. Small details like occlusion of pedestrians or z-fighting on bumpy roads could be identified before the design even reached our operators for a test release.